Key takeaways:
- Domestic airline capacity in China is up 65% since August 2016, but growth is uneven. Capacity on routes over 800km is up 91%, while capacity on routes under 800km has fallen 7%.
- China's largest carriers are retreating from short routes. China Eastern has cut 815,800 seats (-31%) and China Southern 797,100 (-37%), while regional airlines such as China Express (+178%) and Chengdu Airlines (+184%) have grown.
- This is a shift in where airlines compete, not a shrinking market. Capacity is moving to longer routes where rail has less of a time advantage.

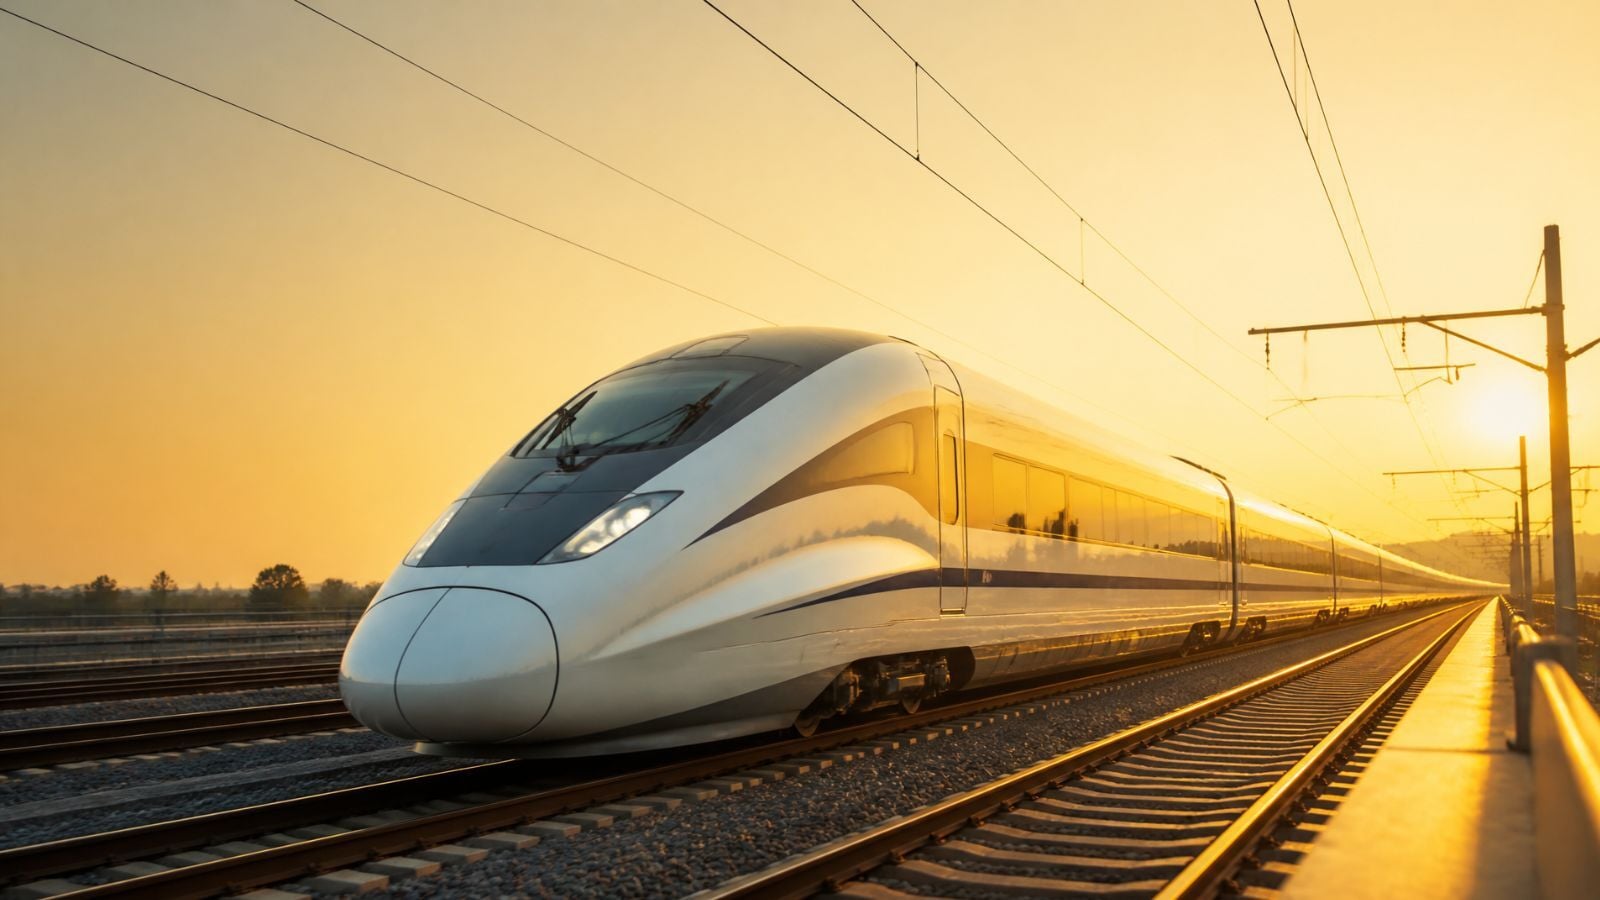
In China, the high-speed rail (HSR) network grew to more than 50,000 kilometres by the end of 2025 - more than the total HSR length in the rest of the world combined. The Chinese government plans to push it toward 70,000 km over the next two decades. The scale is fundamentally reshaping which routes airlines can compete on.
Previous research has identified that HSR poses the biggest threat to domestic air routes under 800km; where HSR journey times are two to three hours and tend to be more convenient and cheaper.
Comparing OAG flight schedule data from August 2026 with August 2016, we explore the impact over the last decade on domestic routes by route length, how capacity has changed for the top 10 carriers and which routes have been most impacted.
For the purposes of this analysis, we have compared routes under 800km.
Segmented growth in China’s domestic air travel market
In the last decade, domestic air capacity in China has increased by 65%, but growth has been highly uneven by route length. Capacity on routes over 800km has increased by 91%, while capacity on routes under 800km has fallen by 7%.
The changes in capacity on routes under 800km are more nuanced:
- Capacity has increased on 190 routes
- 426 new routes have been introduced
- Capacity has reduced on 163 routes
- 293 routes are no longer served
| Route length category | August 2016 | August 2026 | % var. |
|---|---|---|---|
| < 800km | 12,935,397 | 12,012,370 | -7% |
| > 800km | 36,881,312 | 70,324,781 | 91% |
| All domestic routes | 49,816,709 | 82,337,151 | 65% |
Regional airlines grow short domestic routes
Analysis of the top 10 airlines operating on routes under 800km shows a mixed picture. Many of the top 10 carriers have reduced capacity by around a third.
- China Eastern have reduced capacity by 815,800 seats (-31%) and China Southern have taken out 797,100 seats (-37%) compared with the previous decade (August 2016).
- By contrast, regional airlines such as China Express and Chengdu Airlines have increased capacity by 178% and 184% respectively.
Top 10 carriers on domestic routes <800km in ChinaAugust 2016 vs August 2026Seats (millions)August 2016August 2026Source: OAG Analyser
Looking at the share that these routes account for in the 10 largest Chinese domestic carriers’ networks highlights that they are effectively being pushed out of the shorter routes and into longer domestic routes where travelling by air still brings an advantage.
The network share of routes that are under 800km has reduced by 7-18% across the 10 largest domestic Chinese carriers in the last decade. It reduced most for China Eastern (18%) followed by China Southern and Sichuan Airlines (both by 13%).
Shandong Airlines has the largest network share of the under 800km routes, with 26% despite an 11% reduction vs August 2016. These routes represent 17% of Xiamen Airlines’ network, 12 percentage points lower than in August 2016.
Route dynamics
Analysis of the top 5 routes where the most capacity has been added and removed shows how differently short-haul markets are evolving. China Eastern, China Southern, Sichuan Airlines, Kunming Airlines and Lucky Air withdrew or significantly reduced capacity across the five routes with the largest reduction in capacity, while other markets have attracted substantial new capacity.
| Top 5 routes with most capacity added | Capacity added (seats)Aug 2026 vs Aug 2016 |
|---|---|
| KMG-TFU | 159,618 |
| LJG-TFU | 86,513 |
| LHW-TFU | 82,827 |
| DLC-PKX | 78,832 |
| HAK-ZUH | 60,344 |
| Top 5 routes with most capacity removed | Capacity removed (seats)Aug 2026 vs Aug 2016 |
|---|---|
| JHG-KMG | -254,694 |
| INC-XIY | -155,676 |
| LHW-XIY | -138,620 |
| KMG-LJG | -136,908 |
| CKG-KMG | -114,806 |
The five routes with the most capacity added demonstrate where flying can retain an advantage. They connect cities across provincial borders, often linking major hubs with regional capitals. The top three were introduced over the last decade and are highly competitive, with six to eight carriers operating them.
Kunming to Chengdu (KMG-TFU) and Lanzhou to Chengdu (LHW-TFU) cross mountainous terrain between the provinces, while Haikou to Zhuhai (HAK-ZUH) operates from Hainan Island. In each case, flying offers a shorter journey than the rail alternative. China Southern is the sole operator on Dalian to Beijing Daxing (DLC-PKX), with 78.8k seats in August 26, while Hainan Airlines provides over half of the capacity on Haikou to Zhuhai (HAK-ZUH), with 32.6k seats.
The bigger picture
China’s high-speed rail expansion is clearly reshaping domestic aviation, but the impact is concentrated on short-haul routes rather than the domestic air market as a whole.
Over the past decade, capacity on routes under 800km has fallen by 7%, while capacity on longer domestic routes has increased by 91%. The largest Chinese airline groups have reduced their exposure to short-haul flying even as regional carriers have expanded on selected routes, highlighting a broader shift in where airlines can compete most effectively.
The decline in short-haul capacity on routes under 800km is not evidence of a shrinking domestic aviation market. Total domestic capacity has grown by 65% since 2016, with airlines increasingly concentrating aircraft on longer routes where rail has a smaller time advantage.
With China continuing to expand its HSR network and further improvements in train speeds, pressure on short-haul aviation is likely to continue. The bigger question for airlines is therefore not whether HSR will replace domestic air travel, but how far its competitive advantage will extend into longer-distance markets and how effectively airlines can redeploy capacity as the balance between the two modes evolves.