FLIGHT SCHEDULE ANALYTICS
Get ahead of shifts in frequency and capacity
Understand how flight schedules have evolved over time, track where change is happening and uncover growth opportunities across routes and regions using Analyser+.
Get access
Why schedule
insight matters
Airline schedules shift constantly. Frequency rises and falls, competitors move, and new opportunities open, often before they're obvious. Without clear visibility across routes, markets and time, those shifts are easy to miss and costly to ignore.
Understand change across capacity, competition and markets
-
Track and forecast capacity
Understand how flight frequency and capacity have evolved over time and forecast upcoming routes, markets and regions, using schedules data from 1996 to 12 months ahead.
-
Benchmark routes and markets
Compare airline schedules across routes, carriers and regions to understand competitive positioning, identify gaps and uncover emerging opportunities.
-
Visualise, report and decide
Turn complex schedules data into clear charts, maps and reports that support planning, stakeholder alignment and evidence-based decision making across your organisation.
From complex schedules to clear insight
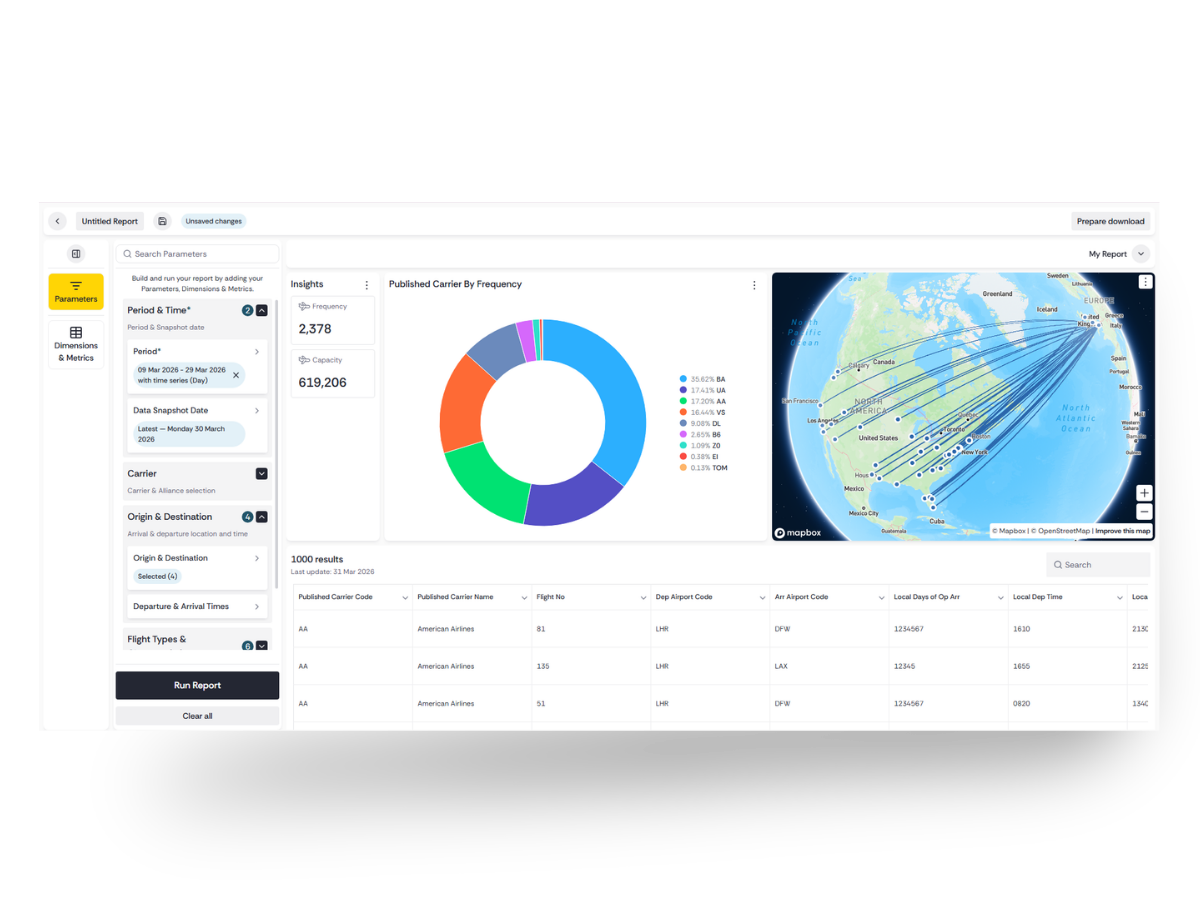
Analyser+ helps you move from global networks to single routes, turning complex schedules data to clear, shareable insight, in just a few steps.
INSIGHT BUILDER
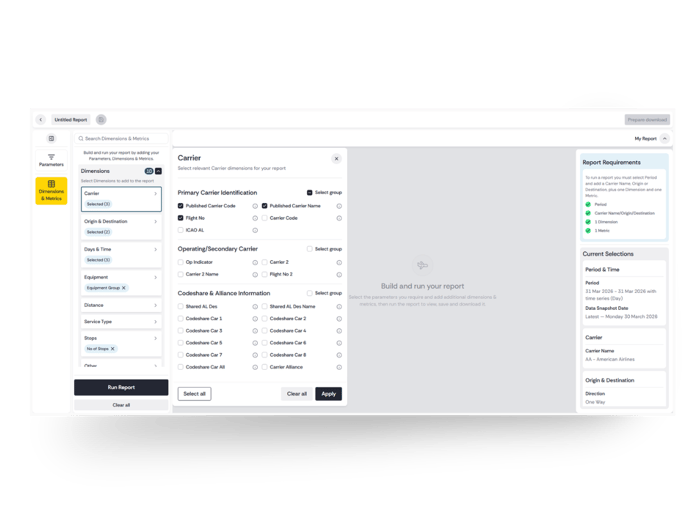
Build the view that matters
Analyser+ helps you move from global networks to single routes, turning complex schedules data into clear, shareable insight, in just a few steps.

SNAPSHOTS
Compare change over time
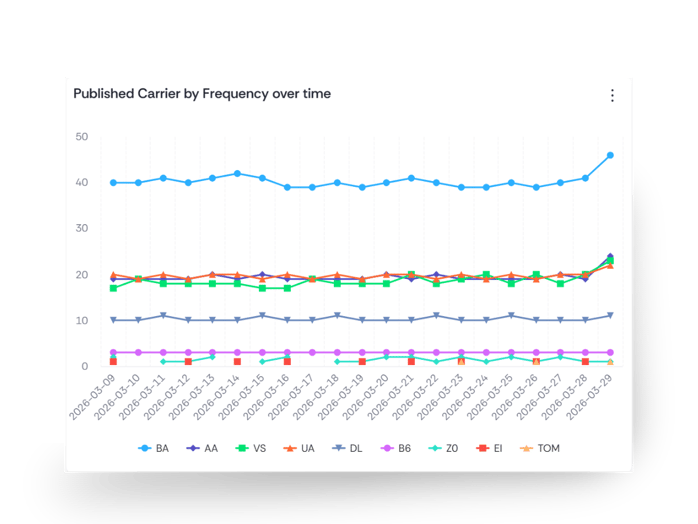
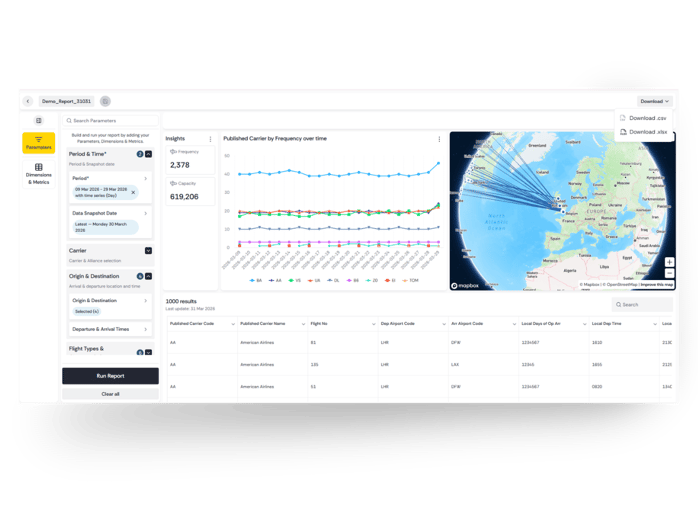
Compare frequency and capacity across past, present and future schedules in one view. Line up weeks, months or years to track how markets have evolved, benchmark competitors and focus on the periods that matter most. Use snapshots to capture specific moments in time and flexible time ranges to surface cleaner, more accurate insight.

INTERACTIVE CHARTS
Visualise patterns and trends
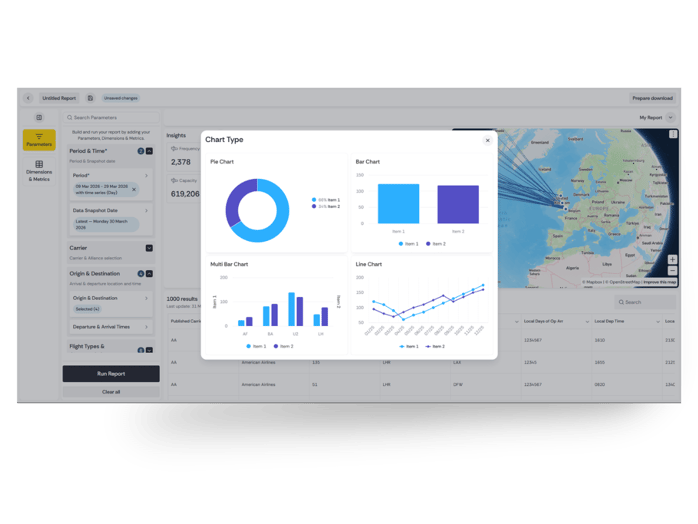
Bring your analysis to life with interactive charts that make patterns easy to spot and comparisons simple to explore. Click, filter and drill into data across charts, maps and tables to uncover trends across routes, regions and networks, and turn complex schedule changes into insight you can quickly understand and confidently explain.

INSTANT EXPORTS
Share, report, act
Export clean, ready-to-use data and visuals in one click. Share any saved report directly with your team via a single link. Move from analysis to reporting seamlessly, with data that's accurate, consistent and ready to share across your organisation.

REPORT TEMPLATES
Skip the setup, start analysing
Build report templates that work the way you do. Save your preferred parameters, dimensions and metrics once, then reuse them across any analysis. Spend less time on setup and more time finding the insights that drive decisions.
.png?width=1200&height=902&name=Schedules%20-%20Custom%20report%20templates%20(1).png)
Built for aviation teams that need clarity
Analyser+ supports teams across aviation who need clarity on how schedules are shifting, and what those changes mean for planning, competition and growth.
-
Airlines
Plan and optimise networks, understand competitive capacity moves and support confident commercial decisions.
-
Airports & route development
Monitor airline behaviour, track connectivity changes and identify opportunities to grow air services and future routes.
-
Consultants & analysts
Analyse long-term trends, benchmark markets and deliver clear, evidence-based insight to support strategic recommendations.
-
Government, tourism & destination
Understand connectivity evolution, assess market performance and inform aviation and tourism development strategies.
Where schedule insight drives action
Analyser+ is used to support some of the most critical planning and market decisions across aviation.
Together, these capabilities support the decisions that shape network planning, market development and competitive strategy.
Planning capacity
Forecast and plan frequency and capacity across networks, markets and routes with confidence.
Route development
Assess route viability and identify where new services can succeed.
Competitive monitoring
Track competitor moves and market shifts as they happen.
Seasonal analysis
Understand how schedules evolve quarter by quarter and year over year.
Growth identification
Spot emerging opportunities across routes, regions and global networks.
Stakeholder reporting
Build clear, evidence-based business cases backed by trusted schedules data.
Trusted by the world's airports
Edinburgh Airport
Edinburgh Airport's Aviation Team needed fast, accurate and flexible schedules data to build credible business cases for new routes, monitor competitor behaviour and forecast demand. With Analyser+, they get the insight they need across route development, capacity planning and operational reporting, all in one place.
Frequently asked questions
-
What is the difference between Analyser+ and Schedules Analyser?
Schedules Analyser is OAG's flight schedule analytics tool. Analyser+ is the next-generation platform that brings Schedules Analyser together with additional OAG data products over time. The new version of Schedules Analyser runs on Analyser+, giving you a faster, more powerful experience alongside new capabilities as they launch.
-
How do airports use flight analytics?
Airports use flight analytics for four jobs: sizing demand in their catchment, tracking which airlines are adding or withdrawing capacity, comparing connectivity against competing airports, and building the evidence base for airline engagement. A route development team will typically start with historical frequency and seat capacity on a target city pair, compare it against similar routes that have succeeded elsewhere, then model what a new service would need to carry.
-
What tools do aviation analysts use to track flight schedule changes across hundreds of airlines?
Aviation analysts track schedule changes using schedule analytics tools that compare published airline schedules across time rather than reading filings carrier by carrier. The work involves lining up past, present and forward schedules in a single view, filtering to the carriers and markets that matter, and isolating what changed between two points. OAG's Schedules Analyser does this across the world's scheduled airlines, with 150+ dimensions and 14 metrics, history from 1996 and 12 months of forward-looking schedules.
-
Which aviation intelligence platforms do financial institutions use to track airline market trends?
Financial institutions typically rely on dedicated aviation data providers since airline performance depends on granular schedule, capacity and route data. OAG's Schedules Analyser is used by financial institutions to track airline market trends, capacity shifts and route network changes.
Get started today!
Start your free trial of Analyser+ and see exactly where capacity is shifting in your markets.