

Air Canada: 2025 in stats
- In 2025, Air Canada increased its capacity marginally (+0.5%) compared to 2024.
- The airline’s capacity remained 13% below 2019 levels, with some notable adjustments to its network - Air Canada is pursuing long haul growth to Europe (+10.1%), while also building connectivity from Central America and Mexico, Latin American capacity for the carrier has increased by 13.2% year on year.
- Capacity in the Asian market dropped by 17% since 2019, and although the Middle East market is a smaller segment, its capacity decreased by nearly 32%.
- The most notable change in the network compared to last year is the drop in capacity on transborder routes of 8%, driven by the weak demand for travel from Canada to the US.
- Air Canada held over 40% market share of capacity at Toronto Pearson (YYZ), Montreal (YUL), and Vancouver (YVR), with Toronto Pearson as its main hub.
Air Canada: Capacity by type
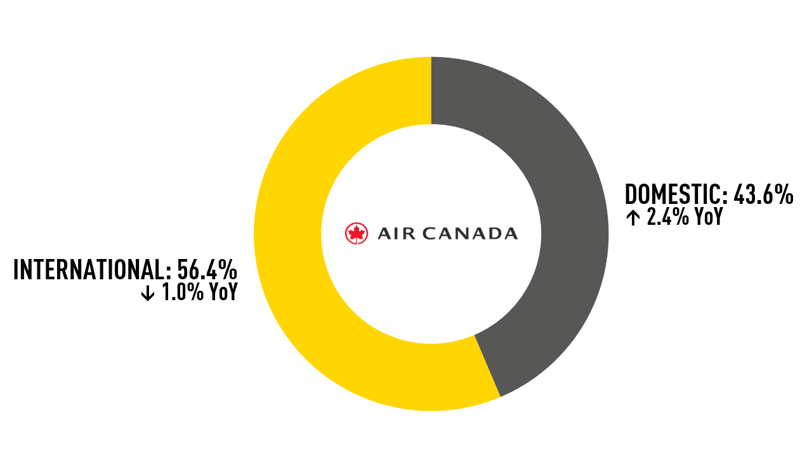
Air Canada: Capacity by region
Air Canada: Top 5 busiest airports
Air Canada: Aircraft fleet composition


.png?width=150&height=150&name=aa%20(1).png "American Airlines")
.png?width=150&height=150&name=BA%20(1).png "British Airways")
.png?width=200&height=200&name=china-eastern%20(1).png "China Eastern")


