


In the last seven days just over 20 million scheduled seats have been removed by airlines around the world; in percentage terms the last week has seen the single largest cut in capacity ever recorded by OAG at a global level. The aviation industry is now less than half the size reported in mid-January as carriers in the United States and India have worked through their recently announced changes.
Chart 1 – Scheduled Airline Capacity by Week Compared to Schedules Filed on 20th January 2020
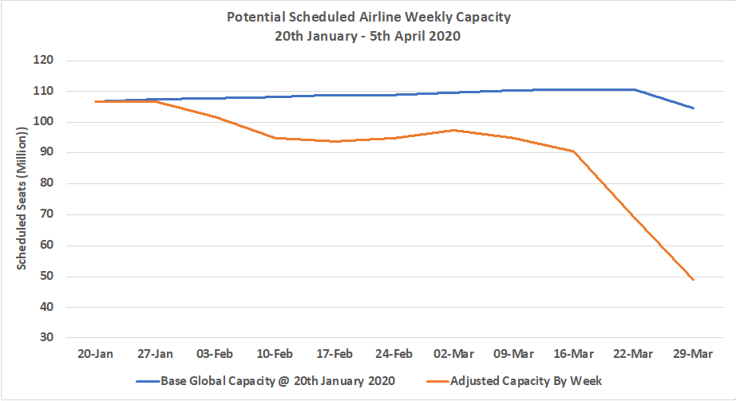
Source: OAG Schedules Analyser
The ten largest regional markets all report further reductions in capacity with South Asia and the Southwest Pacific both reporting around two-thirds of capacity dropped week on week as carriers such as Singapore Airlines (-90%), Qantas (-63%) and Air New Zealand (-61%) have all made further cuts to their planned programmes. Recent optimism that North East Asia was seeing the first signs of some capacity being added have been dampened with both China and Japan reporting week on week capacity cuts although the Chinese domestic market which has shrunk does report an increase to levels above those of last week from the 6th of April.
Table 1 – Scheduled Airline Capacity by Region, 20th Jan – 5th Apr 2020 by Region
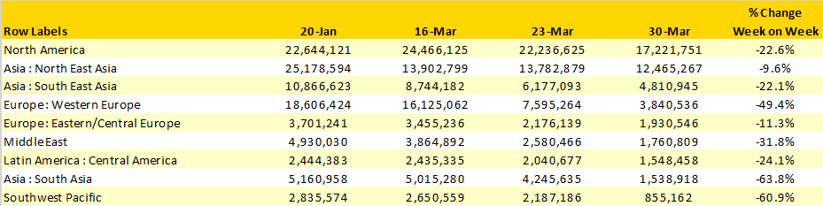
Source: OAG Schedules Analyser
4.4 million fewer seats in the US market relates to a 21% reduction in capacity, of which 3.5 million are domestic seats. A 70% reduction in capacity from India equates to some 3.6 million fewer seats a week with 2.5 million domestic seats dropped in the last week; with further cuts in capacity to be expected in the next week.
Table 2- Scheduled Airline Capacity, Top Ten Country Markets, 20th Jan – 5th Apr Mar 2020
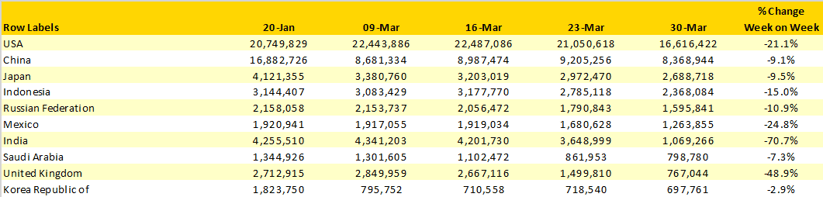
Source: OAG Schedules Analyser
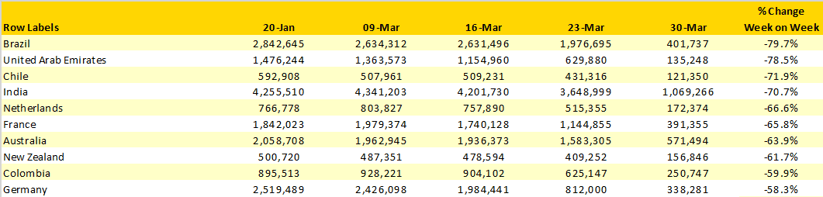
Using 100,000 scheduled seats as a minimum criterion there are fourteen country markets where capacity has more than halved in one week. Whereas last week the largest reductions by country market were in Europe, this week sees a wider distribution of capacity cuts; the major South American markets and the two largest Southwest Pacific markets being included. In many of these markets we are aware of further capacity cuts that have been announced by airlines that have still yet to be filed which will of course further impact capacity next week.
Table 3 – Top Ten Capacity Reductions by Country, 30th March Versus 23rd March 2020
The rate of schedule changes and capacity cuts that are taking place is reflected across the top ten largest airlines weekly capacity chart. Both United and Delta Air Lines have made significant cuts in capacity, United dropping some 1.3 million seats week on week and Delta some 2 million. However American Airlines and Southwest have yet to finalise all of their adjustments and we would cautiously expect those two carriers to collectively be looking at capacity reductions of around 3.5 million in next week’s data if they follow the market trend.
Easyjet have now announced the complete cessation of their services with immediate effect which will of course lead to a further 860,000 seats coming out from global capacity. Similarly, we expect further capacity adjustments to be advised by Wizzair and the three major Chinese airlines as the new restrictions on international services to China that were announced at the end of last week have yet to be notified. The average capacity reduction amongst the ten largest airlines this week was 10,2%, a similar level next week would see a further 1.9 million seats removed; we unfortunately expect a higher level.
Table 4- Top Ten Scheduled Airlines, 20th Jan – 29th Mar 2020
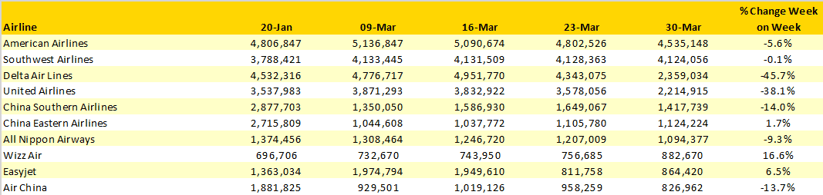
Source: OAG Schedules Analyser
Two of Europe’s major airlines “lead” the table of capacity cuts this week with KLM (-73%) and British Airways (-72%) in percentage terms although LATAM with over 850,000 fewer seats and a 65% capacity cut in one week highlight how deep airlines are having to adjust their capacity.
Table 5- Top Ten Capacity Reductions by Airline, 30th March Versus 23rd March 2020
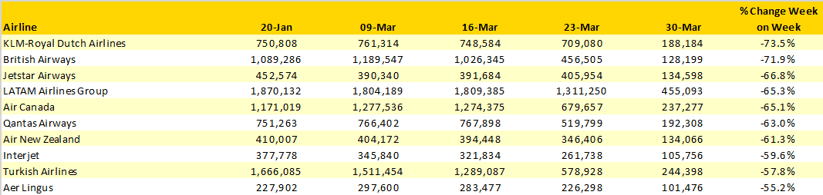
Source: OAG Schedules Analyser
It took the airline industry some eight weeks for global capacity to fall from from 106 million to 90 million; it took a further two weeks for that to fall to 49 million. With a number of schedules updates expected this week and no real signs of capacity in next week’s current data we could expect capacity to be closer 44 million seats a week; and if deeper cuts take place in some of the major markets then we will perhaps get quite close to 40 million a point from which we would hope to begin to see some signs of recovery occurring.

.svg)
.svg)